Using Reports
The Reports Screen
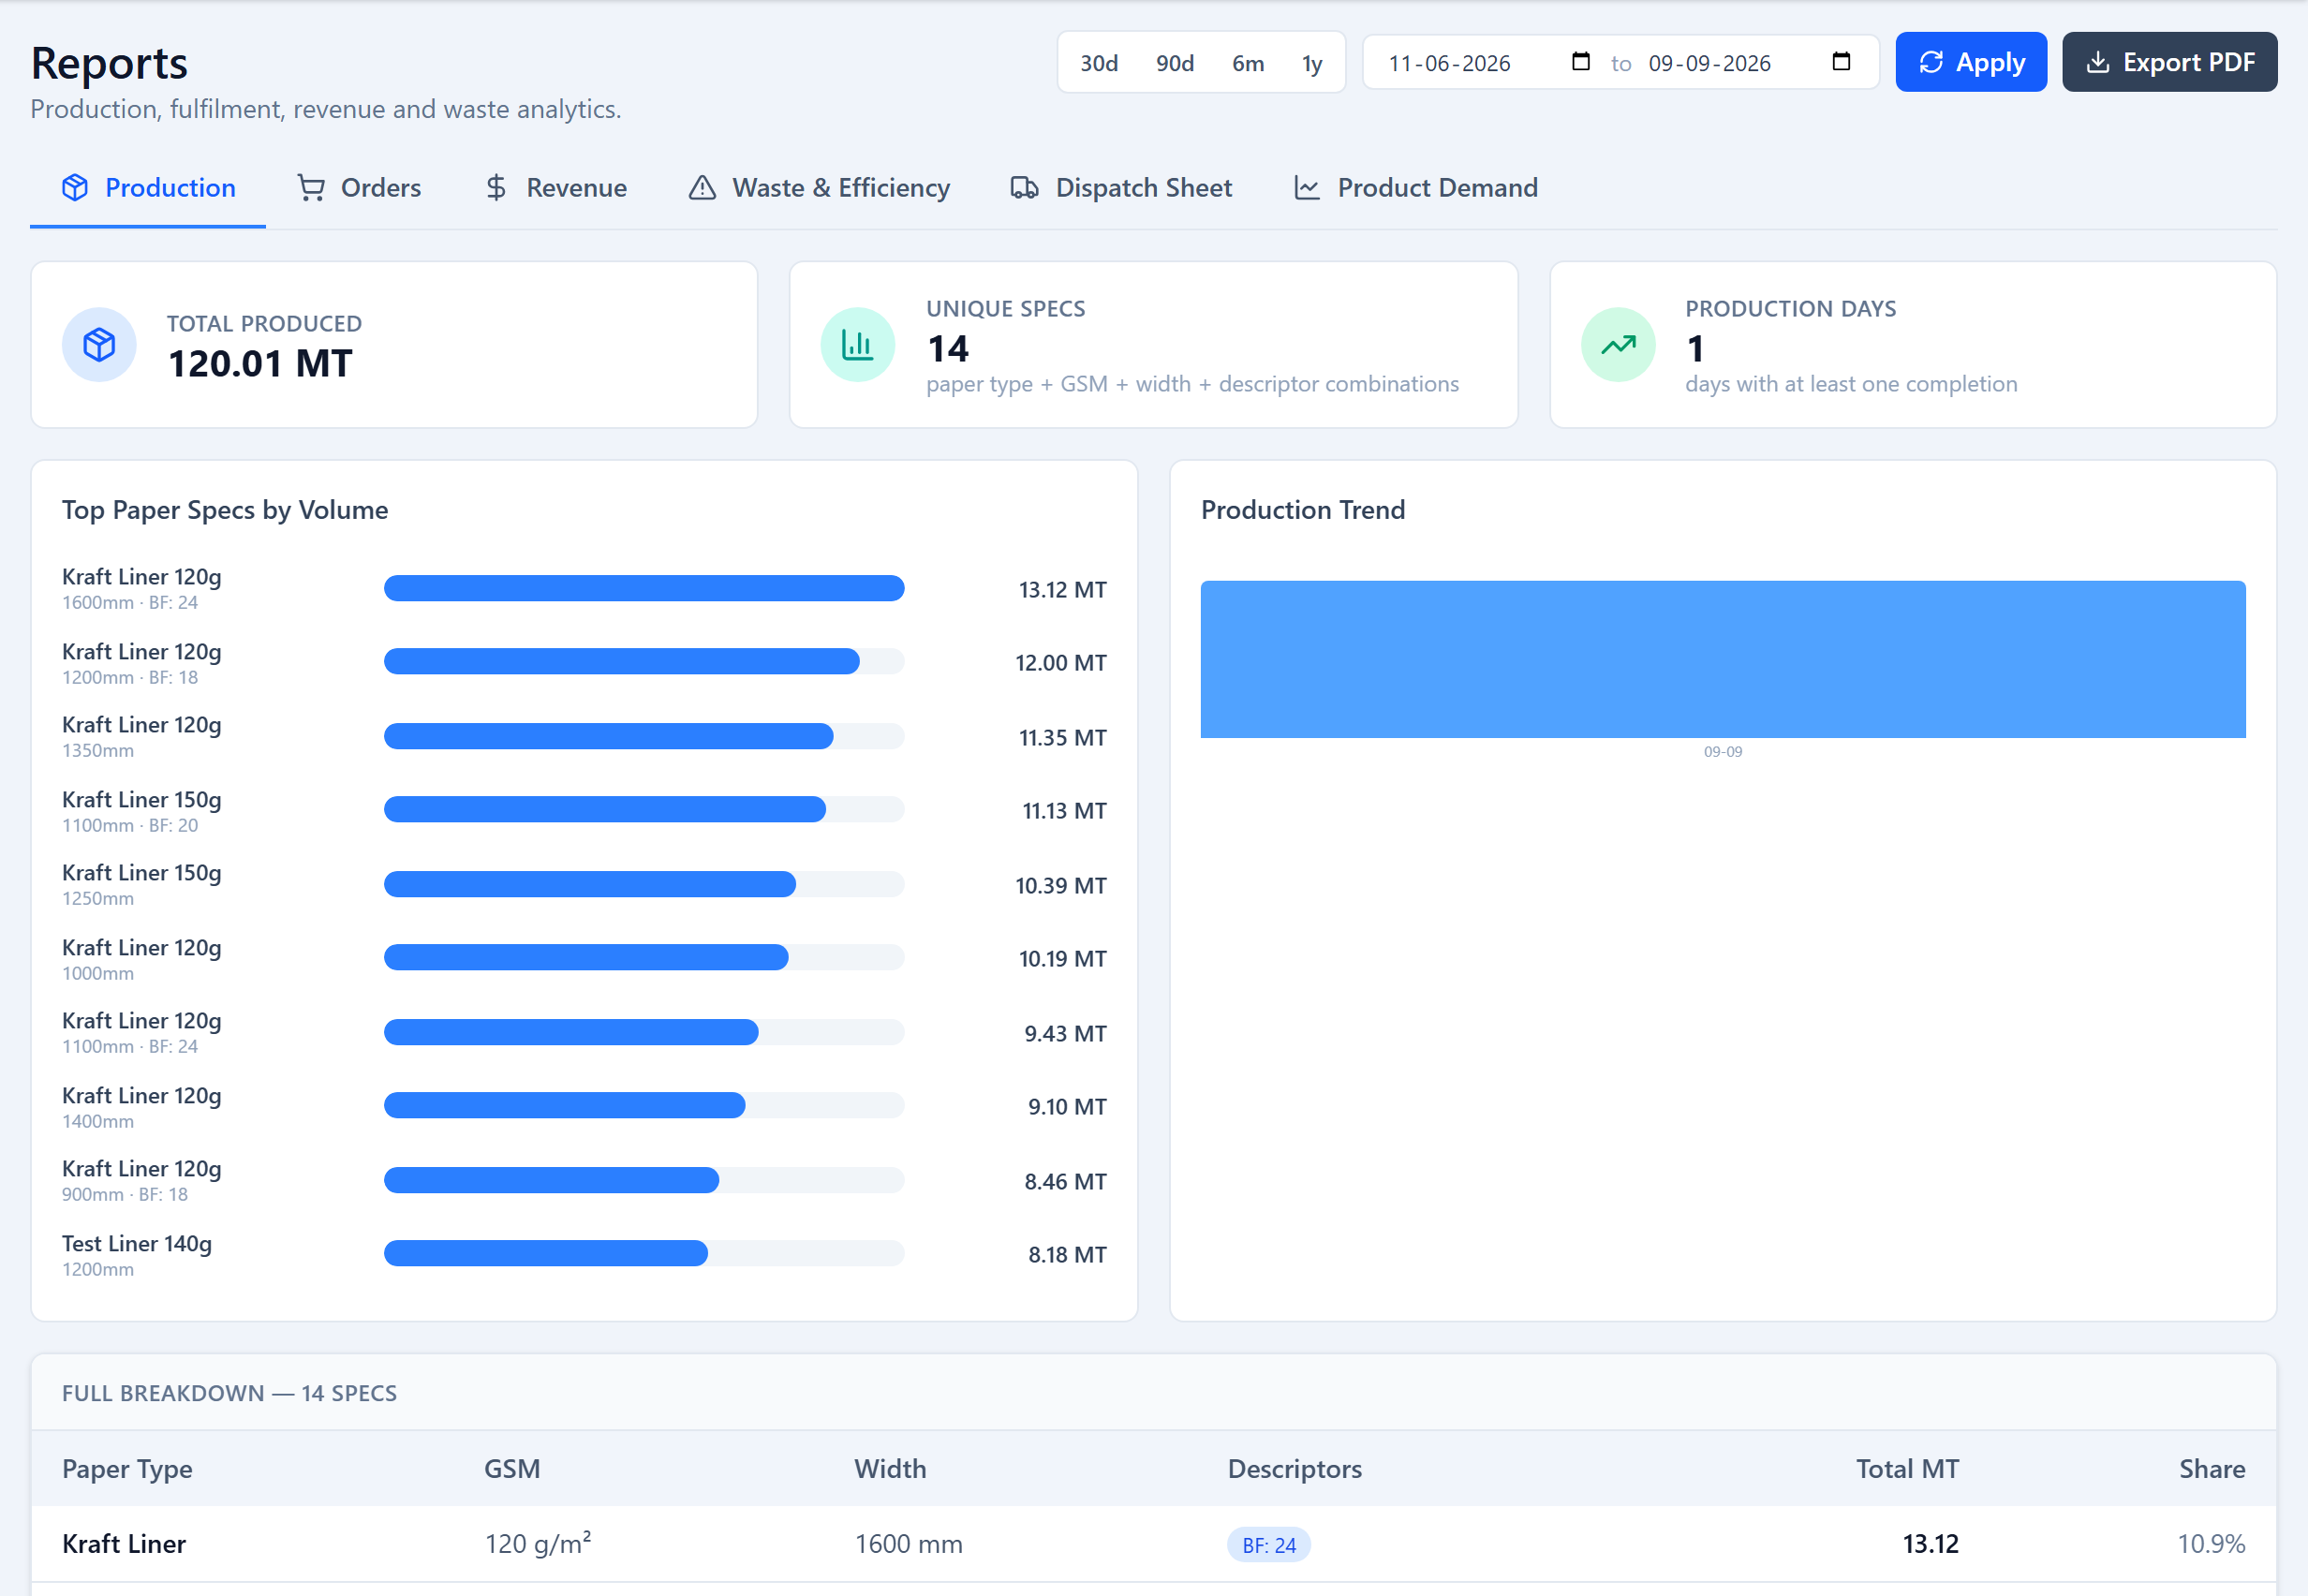
The Reports screen (Admins, Planners and Supervisors) is a set of tabbed reports over a date range you choose. Each tab leads with KPI cards and follows with breakdown tables and charts.
The Six Reports
- Production — total produced (MT), how many distinct specs, and how many production days. See Production & Orders.
- Orders — order count, fulfilment rate, MT ordered.
- Revenue — total revenue and revenue per MT, broken down by customer and by paper spec (needs sale prices on order widths). See Waste, Revenue & Dispatch.
- Waste & Efficiency — average waste %, best-performing machine, runs analysed, per-machine detail.
- Dispatch Sheet — a day's ready-to-dispatch and already-dispatched stock, per customer.
- Product Demand — how often each width has been ordered, over a lifetime / 6-month / 3-month window.
Date Range & Export
Quick ranges are 30 days, 90 days, 6 months and 1 year, or set an exact from/to. Export PDF produces a formatted copy of the current view; several tables also export to CSV.
Was this page helpful?
Something unclear or missing? Reach out and we'll update this page.